12 Metrics for YouTube Analytics Which You Should Be Measuring
Nada Bundalo - September 1, 2021 - Leave your thoughts.
So, you know how to create an awesome video and put it out on YouTube.
Well, that’s fabulous.
But, chances are that no matter how good your videos are, YouTube does not provide your video with a top spot...
The only way to solve it is by getting a good grip on YouTube channel analytics.
So, in this blog, we will understand how to deal with YouTube channel analytics. So the next time you sit down to create/edit your videos, you can tweak it to match YouTube’s expectations.
The key to dominating YouTube's algorithm is to create content that consumers want to see and search for. Looking into YouTube’s statistics will help you determine the kind of video material that will work best.
Once you figure out the content your audience seeks, you can shape your marketing plan and build your YouTube channel. That's a step closer to sticking out from the crowd. Besides, 500 hours of video footage gets uploaded on YouTube every minute, so taking this approach will give you good results.
Views Are Not the Most Important Factor
Views can give you a neat ego boost. However, the quality of those views in the context of engagement and conversion is what actually counts.
Additionally, YouTube doesn't classify its videos according to how many views it gets, but mainly on ambiguous "session time" metrics. It represents the amount of time a visitor spends watching a collection of YouTube videos - including yours - throughout a single viewing session. Sadly, Google/YouTube does not reveal this session time data to users - it's a top-secret, much like the exact method Google uses to rank websites in search.
As a result, we must rely on other indicators that can give us the overall status of the quality of our session time.
In this article, we'll look into 12 metrics that all YouTubers and video marketers should be paying attention to in order to achieve the best results.
- Demographics
- Impressions Click-Through Rate
- Traffic Source Types
- Watch Time
- Audience Retention
- Video Likes, Comments and Shares
- End Screen Click Rate
- Video-Driven Subscribers
- Unique Viewers
- Views Per Unqiue Viewers
- Top Videos
- Playlist Statistics
Let us jump them right away.
1. Demographics
When making a video, you must consider who you're trying to reach and who will be watching it. This metric offers great interactive graphics that help you visualize who is watching your videos based on age, gender, device, and other factors.
If you're selling something, your product/service videos will attract a part of your target audience that you couldn't traditionally reach. Analyzing that audience's age and gender may reveal new data on which to base future product/service presentations.

Source: Single Grain
Jump to the table of contents by clicking here.
2. Impressions Click-Through Rate
Impressions click-through rate indicates how often a visitor watches a video after seeing an impression on YouTube. It's especially significant for creators. If your videos generate a lot of impressions but only a few clicks, it is possible that your thumbnails and captions aren't appealing to your target demographic.
A good CTR is hard to determine since it depends on several factors (mainly the industry you're in), but the average CTR is about 3-5%. For example, if you had seven clicks per 100 impressions, your CTR would be 7%. If your CTR is below 2%, your videos need improvement.

Furthermore, if you receive a bunch of clicks but have a short average view length, users may see your content as bait.
Jump to the table of contents by clicking here.
3. Traffic Source Types
Your reach statistics reveal a great deal about the origins of your viewers. You can monitor if you're obtaining more views from YouTube or external websites. You can also see what other sources are generating video views, as well as what keywords people are using to find your content on YouTube.
How can this YouTube channel analytics tool help you plan your YouTube approach?
If you see that you can increase the total number of views you receive from external sources, your outside promotions probably aren't attractive enough. One thing you can do is add more exciting visuals in order to get more link hits.
On the other hand, if you're having trouble getting views from YouTube, consider improving your YouTube videos' SEO. Draw ideas from the search phrases that visitors are already using to add more relevant keywords to your headers and captions.

Source: Single Grain
Jump to the table of contents by clicking here.
4. Watch Time
The higher the number of minutes visitors spend watching your video, the higher the level of engagement. Approximate minutes watched is a most valuable factor that tracks how long an average viewer spends watching videos on a particular channel, video, or playlist.
The average view length is another key indicator that brings watch time metrics together, and it represents an average length of video playbacks.
By looking at the watch time summary, you can determine how much time your videos have racked up. You can classify every video by watch time and categorize them by topics, genres, and lengths to identify your most attractive forms of videos.
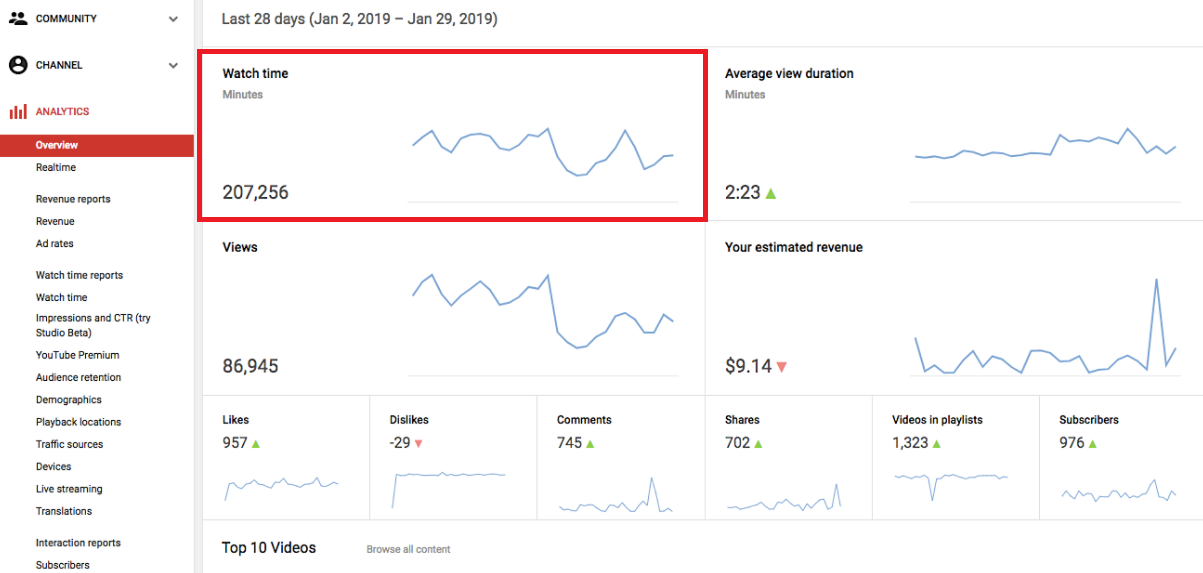
Source: Single Grain
Jump to the table of contents by clicking here.
5. Audience Retention
The rate of people who play and quit your video at each point is displayed in audience retention. YouTube prioritizes videos with strong audience retention in its search ranks and recommendations because they efficiently captivate viewers' attention.
This stat can assist you in creating five-star content by identifying where a reader lost interest in what you're showing. The importance of video quality over quantity is always underlined in digital marketing guidelines.

Source: Single Grain
Jump to the table of contents by clicking here.
6. Video Likes, Comments, and Shares
Ultimately, it's all about engagement. What level of interaction can your videos achieve? If people find your content worthwhile, they will like, comment, and share. Summing up all the video engagement elements by hand is a little challenging, but you can calculate approximate engagement by adding comments and likes.
Comments capture the emotional impact of your video on viewers. Because consumers share thoughts that validate their point of view, those who share your video openly demonstrate their support and respect for your brand. The crowd's likes and dislikes can assist you in figuring out which video themes they prefer. The Interactions Report on YouTube will provide you the engagement data for your videos. This is a good way to get an understanding of your YouTube channel's analytics.

Source: Single Grain
According to the analysis, metrics that rank in the 60th percentile or above are perceived as 'good.' For instance, accounts with a like-to-dislike ratio of 97.4% are doing great. Similarly, profiles with a view-to-subscriber rate of 33.1% or above are quite successful. Accounts with a rate of 0.04% or above for the comment-to-view ratio are operating well, as are those with a rate of a minimum of 3.72% for the like-to-views ratio.
Jump to the table of contents by clicking here.
7. End Screen Click Rate
Suppose your YouTube videos have clickable elements for visitors to subscribe, watch the next video, and so on. In that case, we suggest looking under "Engagement" to see your end screen element click ratio. This YouTube channel's analytic tool displays the percentage of viewers who have responded to your call-to-action.
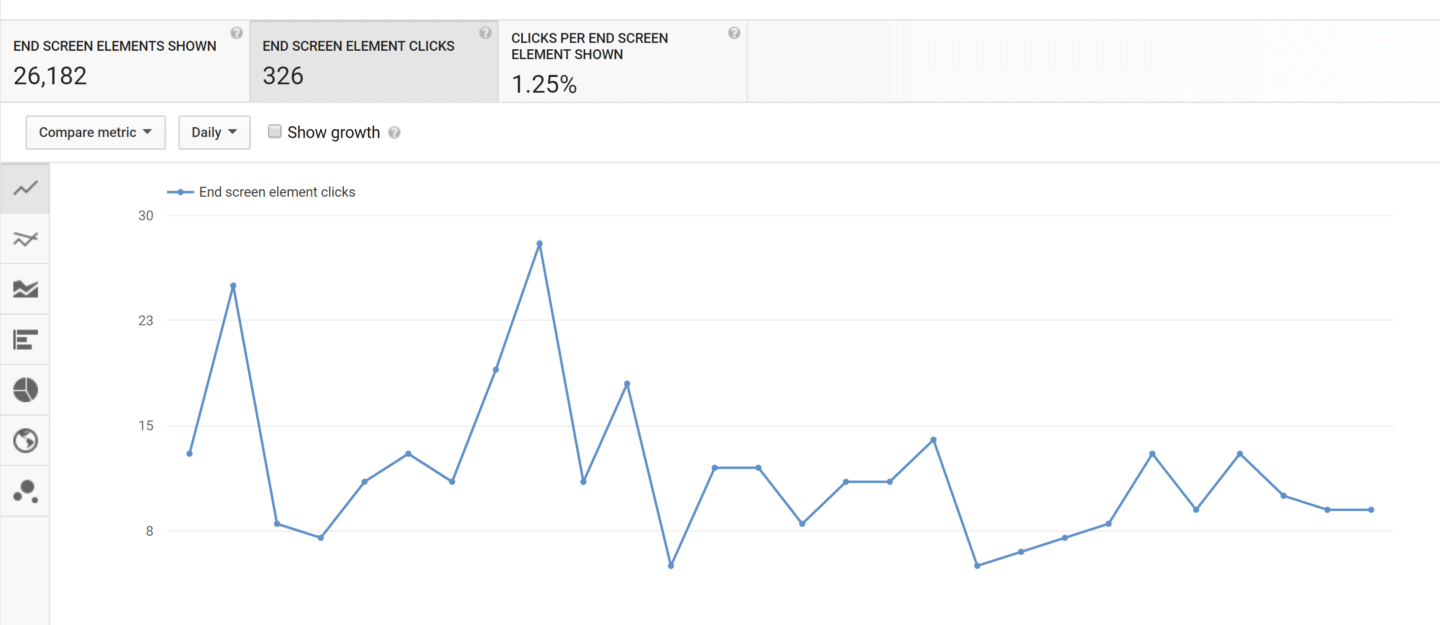
Source: Backlinko
If your click ratio is low, you should think about recommending more related videos for visitors to watch next, including a verbal CTA in your video before the end screen pops up or discovering means to find new individuals who aren't currently subscribed.
For example, if you run a music channel, you can insert YouTube to mp3 or YouTube to mp4 converter CTA so your fans can enjoy your content in other forms - you just need to join YouTube's Partner Program to add external links to your videos.
Jump to the table of contents by clicking here.
8. Video-Driven Subscribers
In terms of YouTube, subscribers are one of the essentials. If you have a large number of followers, more people will notice your video in the YouTube subscriptions category.
People indicate their interest in your content by subscribing to your account. If your videos are highly entertaining, you'll be able to know how many followers each of your videos is generating. You can also monitor how many followers you've lost after they've seen certain content. As explained by Jeremy Vest of the YouTube marketing company VidPow, if you're getting more than 1% subscribers per view (ten new subscribers on every 1,000 views), you're doing good.
Think about putting extra time (or money) into advertising a video that works notably well in contexts of earned subscribers.
Jump to the table of contents by clicking here.
9. Unique Viewers
This metric shows the expected number of people who enjoy your content over a set period. As opposed to channel views, Unique Viewers excludes multiple views from the same user. This YouTube channel analytics tool is quite helpful in assessing the volume of your community. Search for this data under the Reach Views and Audience tab.
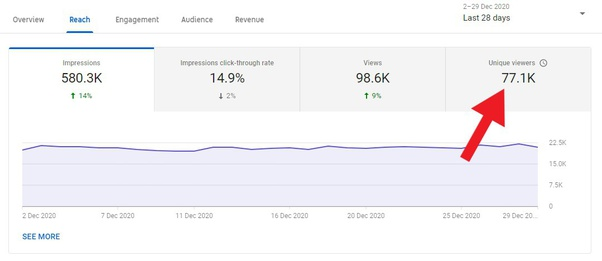
Source: Quora
It can also help you determine how engaged your followers are. If your unique viewers are below your subscriber figure, your subscribers aren't consuming the maximum of your content. Encourage them to turn on a reminder for your new videos to push them into activity and participation.
Jump to the table of contents by clicking here.
10. Views Per Unique Viewers
Views Per Unique Viewers is the number of times a typical viewer sees your video. This metric indicates whether the viewer enjoys it and plays it over and over.
Return to your primary audience profile and apply what you've learned to come up with more outstanding content ideas relevant to your target demographic. Observe which themes assist in boosting the number of views for each user. It may take some testing to master this procedure, but once you do, you'll notice an increase in YouTube views.
Video subjects with a high number of views per unique viewer could be your most powerful marketing tool, and if you explore them more frequently, you'll get more hits and followers.
Jump to the table of contents by clicking here.
11. Top Videos
By checking out your "Overview" stats, you can detect your top-performing videos during a predefined time frame.
If you choose a shorter period (for example, the last week), it's ideal to find your new videos near the top list. If they don't get the most views around the date they're uploaded, you'll recognize they're not delivering enough engagement, or your live promos aren't as successful as they could be.
One of the best scenarios is that previous content that you aren't actively advertising continues to score high ranks. This signals that the headline and description of your video have been polished for a YouTube search. You should probably include keywords that your target demographic actually looks for, and your videos are sure to meet their search query. It means they'll not just click on your content but continue to watch it. Make a list of your successes to use as inspiration for upcoming videos.
Jump to the table of contents by clicking here.
12. Playlist Statistics
Playlists are a great tool to categorize your videos in an easy-to-understand manner. It makes it simple for your visitors to consume content about their primary interests and encourages them to keep watching, increasing your channel's watch time.
Two variables in YouTube's Playlist Report might help you figure out how engaged your playlist is: views per playlist start and average time in the playlist.
Views per playlist start are the average amount of video views for playlists, and it shows how often people start watching your playlists. Much like with thumbnail and title, using a more appealing or straightforward playlist header will bring you more clicks. Try adding new videos at the beginning of the most popular collections to help raise visibility for that video.
Average time in a playlist is the average time people spend watching videos in your playlist before exiting. More time spent enjoying your playlist generates more cumulative views and watch time for your channel. If a playlist's watch time is weak, but the strongest videos at the top of the list to attract more viewers.
Jump to the table of contents by clicking here.
Additional YouTube Channel Analytics Tools
You can use these additional YouTube analytics tools to understand how your account operates in the context of your overall marketing activities.
- Hootsuite - Add YouTube data to your Hootsuite panel and track the performance of your videos and channels against your other social media accounts. You can also set up automatic reports to run on a regular basis.
- Social Blade - If you're curious about how your adversaries, possible partners, or authority figures are doing on YouTube, you can try Social Blade to see how they're performing and compare their channels to yours.
- Google Analytics - Aside from a parent corporation, Google and YouTube have something else in common: they're both about search and traffic. Initiate YouTube monitoring in Google Analytics to get a better understanding of how visitors find your channel. You can precisely identify what type of videos your community reacts to and which social networks they favor.
- VidlQ - This Chrome plug-in shows a scorecard next to the video you're playing, providing insights and data to help you grasp how YouTube works.
Wrapping It Up
YouTube analytics can tell an insightful story about the success of your video content. However, bear in mind the fundamentals: YouTube wants users to find the answers to their questions and spend more time watching videos. If you concentrate on what your viewers are looking for and get your analytics game right, you can use those findings to make more compelling content and rule YouTube.
Author bio: Nada Bundalo is a Content Manager at IntercoolStudio digital marketing agency. She works in content publicity. Privately she loves horticulture and she is an unshakable optimist who always shares her gelato.